 Written by: Jim Gilbert, Senior Consultant
Our last blog ended stating that we would further discuss:
- DMAIC
- Process Control
- Process Capability
We will also discuss:
- Process Variation
- Standard Deviation
DMAIC was briefly discussed in the previous blog. It is a problem solving methodology. Once the problem is described (Define) we attempt to identify the various input and output variables that matter regarding the behavior of the process. Often the output variables are the one(s) that are out of the specifications. We try to determine which input variables can be causing the output variable(s) to vary excessively.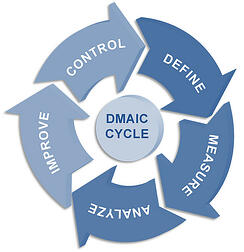
Once we think we know which input variables are causing the output behavior we begin to Measure them. We will develop a measurement plan that will begin to provide us with enough data that we can go to the Analysis step (Analyze) in the DMAIC methodology. An example is we measure the first five parts produced at the top of each hour of production. As a rule we need at least 30 observations to provide enough data to represent the process behavior. In this case we want 30 sets of five parts each or 150 parts.
Based upon what we learn we adjust the process (Improve) until we have eliminated the excessive variation. The DMAIC process is iterative – we continue to perform the steps until we get the desired outcome.
When we have achieved the desired outcome, an acceptable yield, we institutionalize the improvements so that the source of the excessive variation is eliminated. This step (Control) is accompanied by a Control Plan to ensure that the outputs continue to be at an acceptable quality level. The Control Plan also prescribes countermeasures if a problem occurs.
In summary, DMAIC is a problem solving methodology that assists the practitioner to approach a problem with excess variation and systematically solve it. The Control Plan includes implementing Statistical Process Control to monitor the process and ensure that it continues to function properly over time.
Statistical Process Control is the tool that we use to measure control. You may remember that, in the previous blog, we said if a process is Capable and in Control, you will, by definition, get the outcome that the process was designed to produce.
 Before we talk about Process Capability and Process Control we need a discussion to better understand variation. Variation exists in every process. Notice the variation when you get gas for your car. It changes. The output variable is MPG (Miles per Gallon). The input variables include tire pressure, ambient temperature, highway driving vs. city driving, the condition of the engine and many other factors.
As we think about this further we can understand that there are actually two types of variation:
- Common Cause (Inherent) Variation
- Special Cause Variation
Inherent variation is named that because it is simply variation that is inherent in the process. It is just part of it. This variation is usually random. This is a very important point. Random variation is graphically depicted as a bell-shaped curve. More on this later.
Special Cause Variation is named that because it is variation that is not a direct feature of the process but is affecting its results. Examples are a bad setup for a machine or, in an office setting, it could be illegible handwriting that causes data entry mistakes. In both cases these affect the outcomes of their respective processes but are not inherently part of them. We must first eliminate these sources of variation.
Standard Deviation[1] is a measure of variation so it is an actual number. It is the result of a relatively simple calculation. We will discuss this in the next blog and discuss how the Standard Deviation number is used to calculate Process Capability (generally accepted to be 4 Ϭ[2] or four Standard Deviations [4 times the Standard Deviation]) and used for Statistical Process Control (approximately 3 Ϭ or three Standard Deviations).
Jim Gilbert, CMTC Senior Consultant

Leave a Comment